
Where did all the money go?!?! Do you ask yourself that question every month? This month, on Financially Savvy Fridays, my fellow contributors and I are talking about How to Build Your Budget. Last week, Study at Home Mama, The Single Entrepreneur, shared downloadable budget planning worksheets. But how do you know what to actually plan for? As a former financial analyst, I was trained to analyze the past to predict the future. Do the same thing when planning your budget, and discover your hidden budget busters!
Finding Your Hidden Budget Busters
As a Financial Analyst, I followed a methodology for analyzing businesses for potential investment. You can apply the same methods to your own personal finances to better forecast your budget, and reduce the likelihood of unexpected expenses and budget busters. The key steps are as follows:
- Collect and organize your data
- Examine data for budget busters
- Compare to benchmarks
- Set your budget projections
I will walk through each of these steps in greater detail below, including how to perform each task, as well as providing links to resources to help you along the way.
Collect and Organize Your Data
In the case of household budgeting, your data is everything you have spent. It’s easy to know what you spend every month on constant bills, like your mortgage and car payment. They are highly predictable, and typically, this isn’t where your budget goes awry. It’s on all the little one-offs – dinner out, daily coffee runs, that pair of shoes you just had to have!
You want to collect, organize and analyze all your transactions. This is super easy, if like me, you spend everything electronically. I use one major credit card that I pay off every month and a debit card. All banks and credit cards provide you the ability to download your statements, and most even allow you to do it directly into Excel. Do that now.

You can start with just a month’s worth of data, but I recommend doing the last year’s worth to really see your spending habits. If you live a more cash-based lifestyle, you will need to save receipts and manually track your spending for a month or two before you can analyze it.
Spending Categories
Next, brainstorm a list of categories to apply to your spending items. Keep them broad enough to limit them to 10-12 in total. Later, you can delve into categories you note irregularities in. Categories will vary for everyone, but common ones might include:
- Housing – mortgage, property taxes, insurance, security, HOA fees
- Utilities – phone, cell phone, gas, water, electric, cable, internet
- Transportation – auto payment, insurance, gas, public transportation
- Food* – groceries, restaurants
- School/Childcare – tuition, daycare, babysitters, extracurricular activities
- Health/Medical – insurance, co-pays, prescriptions
- Clothing – kids, adults, dry cleaning
- Entertainment
- Travel
- Debt Repayment
- Savings
- Other*
* I would recommend splitting Food from the beginning into Groceries and Eating Out, as the latter is a frequent budget buster. The Other category is a catch all, but you should make sure you have enough broad categories that the spending lumped into Other is not substantial.
Organize Your Data
Once you download your data, it may appear in several different formats. To analyze it, you will need to format it to all fit in the same table, with uniform headings. Use it to complete the table in the Google Spreadsheet linked below.
Analyze Historical Spending Data Sheet
Before adding your data, save a copy of the file for yourself by clicking “File” then “Make a Copy”. Then, replace the sample data with your own. The key data points you want for each transaction are: Date (YYYY-MM), Merchant, and Amount ($). Last, enter the relevant category for each line item. This is the most time consuming part of the process.
Analyze Your Data for Budget Busters
Once you have assigned a category to every expenditure, it’s time to analyze your data. Spreadsheets make this super easy with Pivot Tables. While on the Spending Data tab of your spreadsheet, click “Data” then “Pivot Table”. Google will automatically create a new tab for you, and open the “Report Editor.”
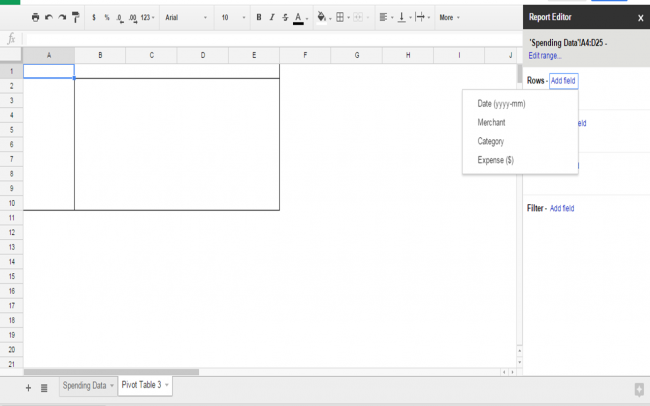
Click on “Add Field” for Rows and select “Category”. For Columns, select “Date”; and for Values, select “Expense”. This will automatically sort and total all your expenditures monthly, by category.
Voila! Please note: I just used some sample data – it is not accurate or representative of real expenditures, and should be replaced with your own data.
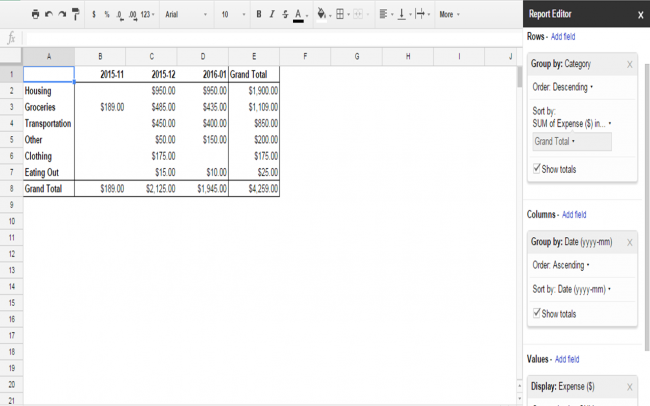
This should provide you with a quick and easy snapshot of what your monthly and annual expenditures look like across categories. Examine the data for outliers (a month where food was 50% more than any other month, or Other has a large total you can’t explain). Go back to your complete list of expenditures and try to explain any of these for yourself. Perhaps you need to break a category into two, and re-run your table to get a better picture. (Note: one benefit to using Excel vs. Google Spreadsheets is you can click on a number in a PivotTable and it will pull up all the relevant data points!)
I’ve fully completed this process myself now twice. The first time I did it was when we decided I wouldn’t go back to work. This process revealed how much money I was spending on 1) gas for commuting and 2) clothing – suits, designer shoes, and dry cleaning ($100s a month!). We also used it to determine what kind of household budget I would need every month.
The second time I completed this, I did it to see how my expenditures compared to the household budget we had estimated the first time. I seemed to be going over every month. The culprit immediately leapt out – clothing. This time not for me, but for the kids! I couldn’t believe how much I had spent, and it was a great reminder to curtail the habit quickly.
Compare to Benchmarks
When making an investment, we often compare the reported results to benchmarks. How does a company’s peer perform? Or how did a stock perform relative to the broader market? You want to do the same thing with your historical spending. A good benchmark to compare it to is the Consumer Expenditure Survey from the Bureau of Labor Statistics. The most recent data available is from 2011.
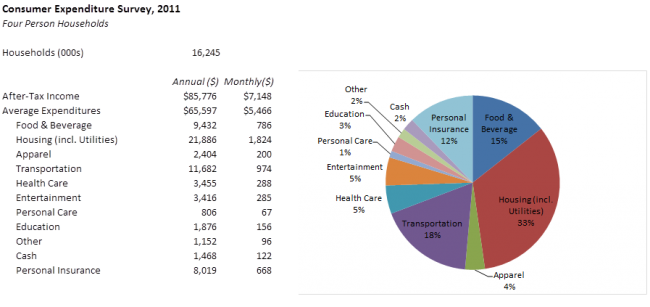
Source: Consumer Expenditure Survey, 2011 – http://www.bls.gov/
How do your household expenditures compare? Note this data is representative for four person households in the United States in 2011. Why compare? Maybe you are dramatically over-spending on housing (or maybe your housing costs are high because you live in a high-cost of living region). Maybe you are significantly under-spending on Personal Insurance. As income decrease relative to the average, Food and Housing often become a larger percentage of expenditures, and conversely, as income increase, they become smaller percentages of total expenditures.
Set Your Budget Projections
Now, having thoroughly examined and analyzed your historical expenditures, you are ready to set your budget projections. You can use Study at Home Mama’s downloadable worksheets to do it! You won’t overlook or underestimate the cost of your daily coffee habit, because your thorough review of your spending history revealed just how much it costs you. You now know you spend $200 a month on dry cleaning – another one of many budget busters revealed. Maybe you’ve decided to cut back because of it!
Did you uncover your hidden budget busters? Are your budget projections now better informed? And most important of all, are you now more aware of just where your money goes every month? Suddenly, those unexpected expenses won’t be so unexpected.
I spent years living in spreadsheets, and even dreamed in spreadsheets sometime, so if anything above is confusing, feel free to comment with your questions. Join us again next week on Financially Savvy Friday when Melody, The Cycle Breaker, shares her take on building a budget for those who might not be so good at it!
If you enjoyed this post, follow the weekly series on my Financially Savvy Friday landing page. You can also find all the posts in the series, as well as Financial Savvy from around the web on my Financially Savvy board on Pinterest.
1 comment
[…] month, you made your budget, and (gasp) realized how much you actually spend! You might be thinking, I pay HOW MUCH for […]